
Synthetic Control Method for Estimating the Effect of the Climate Change Act of 2008 in Britain

Pluralist Economics Fellowship, 2020
This essay is part of the Pluralist Economics Fellowship, jointly put together by the Minerva Schools at KGI & The Network for Pluralist Economics.


Synthetic Control Method for Estimating the Effect of the Climate Change Act of 2008 in Britain
Aaron Morales Shildrick
Introduction
Here we look at the effect of the 2008 Climate Change Act passed in Parliament in the United Kingdom as an effort to curb emissions in all sectors. The Act aside from setting goals to become a low-carbon economy sets up an independent committee on Climate Change to ensure the implementation of policies to comply with the ultimate goal of 80% reduction in total emissions in 2050. I make use of the Synthetic Control Method (SCM) to create a comparative case study in which the creation of a synthetic UK serves as a counterfactual where the treatment never occurred (Cunningham, 2018).
Increasingly, the urgency for decarbonization is increasing across the globe. However, the cost-benefit analysis from renewables, for example, is still contended, which is why many countries have stagnated in implementing effective policies (Blazejczak et al., 2011).
Transportation accounts for 15 per cent of the total greenhouse gas emissions globally (Pålsson & Johansson, 2016), which signifies a massive amount of emissions. Freight transport is the biggest threat to the environment within the transport sector and accounts for much of the emissions of the industry sector as well. To further discuss this, many barriers to reduction of emissions still stand, such as the energetic power of burning fossil fuels, and the need for rapid growth to solve other social issues (Pålsson & Johansson, 2016). Adding more, the complexity of the systems of both government and private sector, and a lack of measuring tools and effective policy research also stagnates action taken by both governments and corporations (Arroyo, Zyla, & Pacyniak, 2017).
According to Pye, Sabio, and Strachan (2015), the fact that decarbonization in all industries is a must prevails, but one of the most complicated issues faced is uncertainty. Research is turning its focus on predicting, measuring, and understanding uncertainty to provide a more solid ground for climate policymakers. Being able to evaluate the effect of a policy is a debate that has resulted in many advances in statistical methods for estimating causal effects.
Turning our attention back to the policy at stake, the United Kingdom boasts one of the most ambitious climate policies globally: the 2008 Climate Change Act (UK Government, 2008). This policy is innovative as it is the world's first legally binding unconditional national legislation to reduce greenhouse gas emissions (Lorenzoni & Benson, 2014). The UK has long been established as a leader in international climate change agreements as one of the most innovative countries to tackle the problem domestically by introducing policy instruments such as tax levies, fuel duties and emissions trading for this purpose (Lorenzoni & Benson, 2014). The 2008 Act comes about as a result of the inaction of the government to comply with international agreements with limited coercive power. Additionally, this Act further establishes the UK at the forefront of international responses. On the other hand, Rayner and Jordan (2010) argue for the 'fortuitous' manner in which the UK has earned that title, by deriving emission reductions from policy changes in other countries and sectors.
Data
I compiled the data used for this analysis into a panel of the European Union, measuring different indicators from 1990 to 2018. The individual data indicators came primarily from the European Union Open Data Portal and the World Bank. Using these two sources, we can be reasonably sure of the results as they are reported by government agencies for the EU Open Data Portal, and the World Bank investigates independently. The goal of my compilation was to find the most appropriate categories or indicators that apply across all of the European countries. For specificity, I now list all of the variables included in the dataset. As a general practice for the SCM, the explanatory variables must be relevant to the makeup of the dependent variable.
Dependent variable:
- Pollutant emissions from transport - Measured yearly, this variable represents an index (year 2000 = 100) for pollutants from transports measured across the country. This variable included the compounds of nitrogen oxides (NOx), non-methane volatile organic compounds (NMVOCs) and particulate matter (PM10). Emissions are officially reported under the UNECE Convention on Long-Range Transboundary Air Pollution.
Explanatory variables:
- Population - A common indicator used as an explanatory variable. Includes the yearly data on all countries in Europe with the number of people living in the country not restricted to citizens.
- GDP per capita - A measure of economic growth accounting for the population measured yearly.
- Purchasing power - Represents a common currency that eliminates the differences in price levels between countries allowing meaningful volume comparisons of GDP.
- Gas price - Pump price for gasoline measured every two years starting in 1995, showing the price in US dollars for gasoline, which is an important predictor on emissions from transport specifically.
- Total CO2 emissions - Total amount of Carbon emissions measured yearly from 1990 to 2014. This indicator includes data from the Carbon Dioxide Information Analysis Center, measuring the results in Kilo Tonnes.
- Renewable energy share - Percentage of energy produced from renewable energy sources.
Now that the variables in the dataset have been described, we must look at some of the salient facts in the data. As we noted in the introduction, our outcome variable is emissions from transportation, and to accurately visualize and contextualize, figure 1 shows the trend over time.
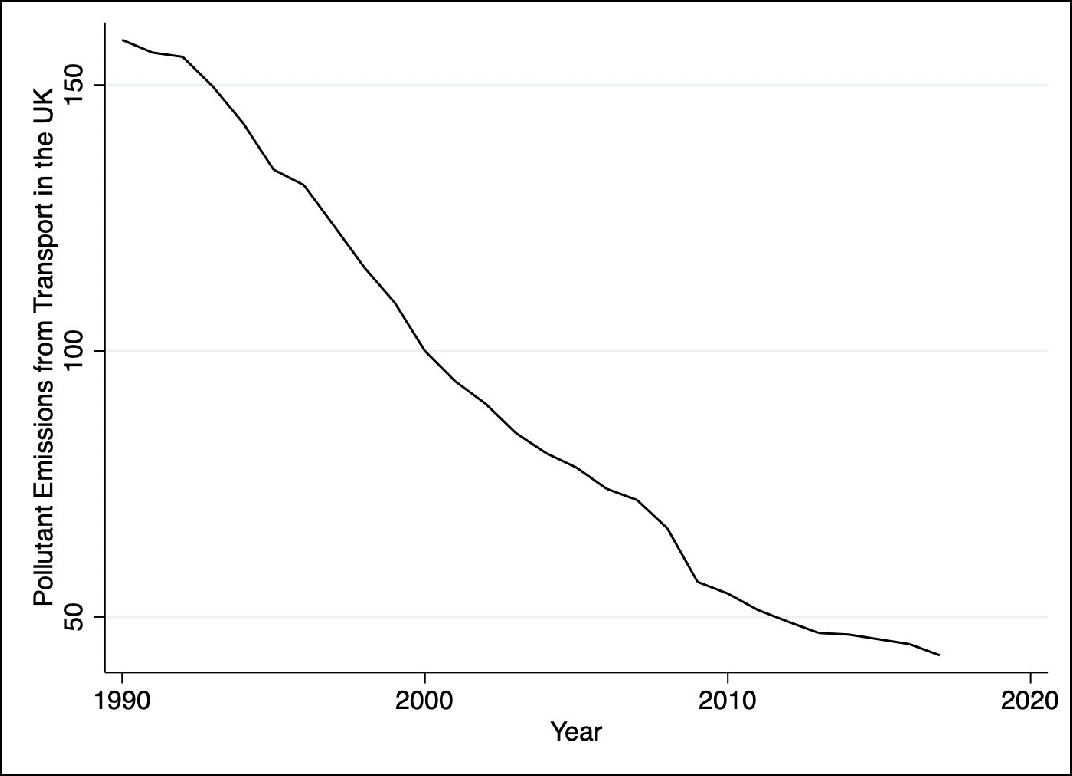
Figure 1. Pollutant Emissions from Transport in the UK over time (values given in index form). Data: (European Union Open Data Portal, 2019)
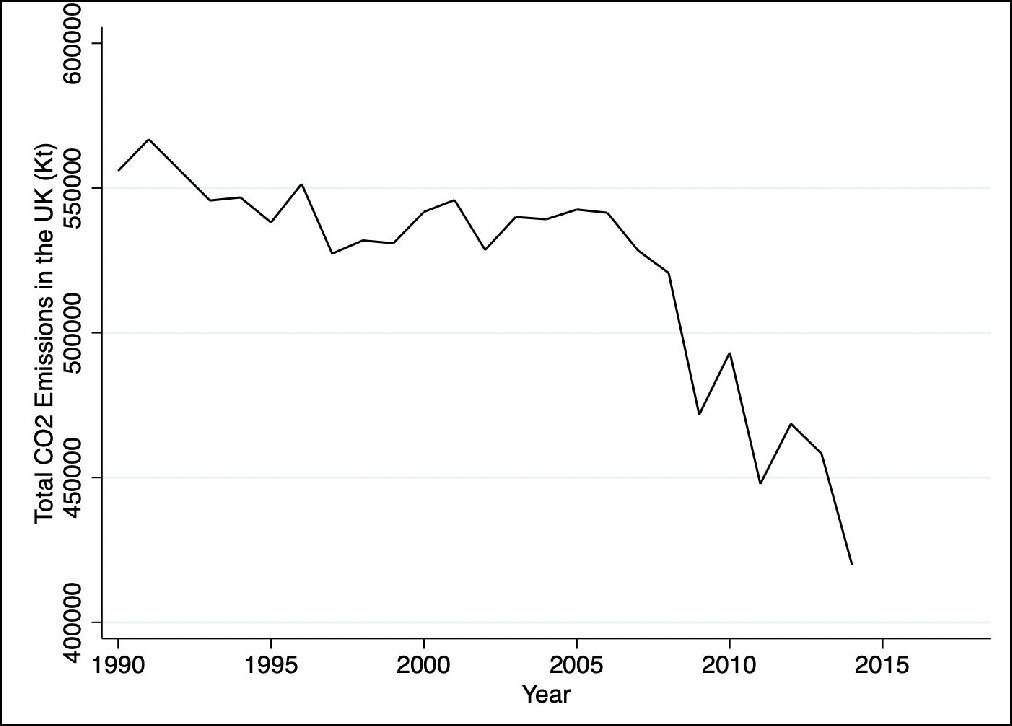
Figure 2. Total CO2 emissions in the UK (measured in Kt). Data: (World Bank, 2019)
This data can also be complemented by showing the same trend in total CO2 emissions as well, as there is a visible negative trend in the amount of emissions all-round, opposing the global trend showing an increase worldwide (World Bank, 2019).
As the figures show, there has been sharp decreases in emissions over the past 15 years or so, but we still must show where the UK ranks most recently in regards to CO2 emissions compared to the rest of Europe. We know the UK to be one of the biggest economies in Europe and has had a long industrial history; which is why figure 3 displays the CO2 emissions gathered in 2014 as it is the most recent year in our dataset. The graph is displayed in Total CO2 as the emissions from transport is given as an index and is not as informative when drawing comparisons from visuals as all numbers are relative to each other.
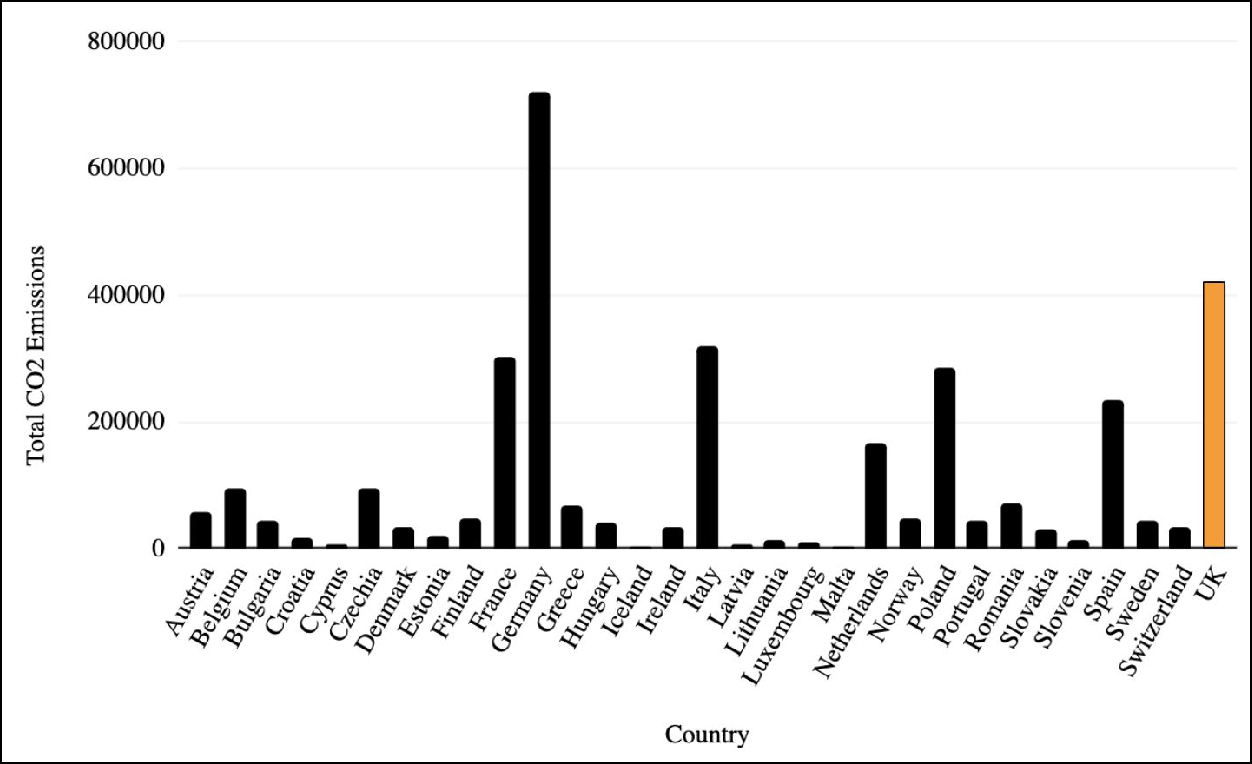
Figure 3. Total CO2 emissions in 2014 per country. Data: (World Bank, 2019)
Now we have set clear that the UK is reducing carbon emissions, but remains one of the largest polluters in Europe. The data discussed will be used to show the effect of the 2008 Climate Change Act, aimed at reducing emissions in a broad manner across all sectors, on the emissions from transportation, aggregating public transport, personal transport, and industrial transport. Because Greece, Iceland, Norway, and Switzerland don’t have data on transport emissions, they are removed from the dataset.
Methodology
The Synthetic Control Method is employed in this paper because of many reasons. For one, this method precludes extrapolation. It uses interpolation instead because the causal effect is always calculated by comparing the vertical distance between the control and the treatment.
Unlike regression, data processing does not need access to post-treatment data, which helps eliminate bias as there is no reason to "peek" at the data beforehand. Another advantage of the method is the fact that you can have different weights in making up the synthetic counterfactual; and additionally, the algorithm finds the optimal weights, removing subjective research bias (Abadie, Diamond, & Hainmueller, 2010). The SCM is also transparent as researchers can evaluate how well the synthetic control's outcome matches the affected region's outcome before the policy change, with the added benefit of known donor regions and exact weights provided (McClelland & Gault, 2017).
This method relies on three assumptions listed below:
- Placebo assumption: Only the treated unit is affected by the policy in the periods employed for the model.
- Parallel trends assumption: In the absence of treatment, the treatment and control groups are constant over time. The policy has no effect before it is enacted.
- Counterfactual assumption: The counterfactual for the treated unit can be approximated by a combination of donor units or the donor pool.
An additional fourth assumption is listed to provide more effective use of the SCM.
- No other unit in the donor pool received a similar treatment in the studied period.
Relevant to the assumptions, we must consider some of the strengths and weaknesses of this study. By looking into emissions from transport, assumption 3 is valid because the inclusion of variables such as GDP and gas prices, the fit in the pre-treatment period is very good.
Additionally, the predictor balance table also offers more insight into this. Assumptions 1 and 2 can be addressed directly with economic research, which clarifies the importance and uniqueness of the policy globally. Being a legally binding policy passed domestically in the national Parliament, we can be sure it affects only the UK and has not anticipation effect as it is the first of its kind. We must consider the potential spillover effects of the policy, as Lorenzoni & Benson (2014) notes the way innovators oftentimes take leadership roles in climate action. Additional to this, we have seen a rise in environmentally-focused policies, but all lack the depth and the anticipation of the UK Climate Change Act of 2008 has. Assumption 4 might be threatened due to this fact and consideration of this is important to note.
Results
As discussed previously, a synthetic control for the United Kingdom is created to estimate the causal effects. The model is trained on data starting in 1990 with the treatment being in 2008, and results showing into 2014, using our compiled dataset. Since no single unit is as good of a fit for the pre-treatment period, table 1 shows the predictor balance between the actual UK and the synthetic UK.
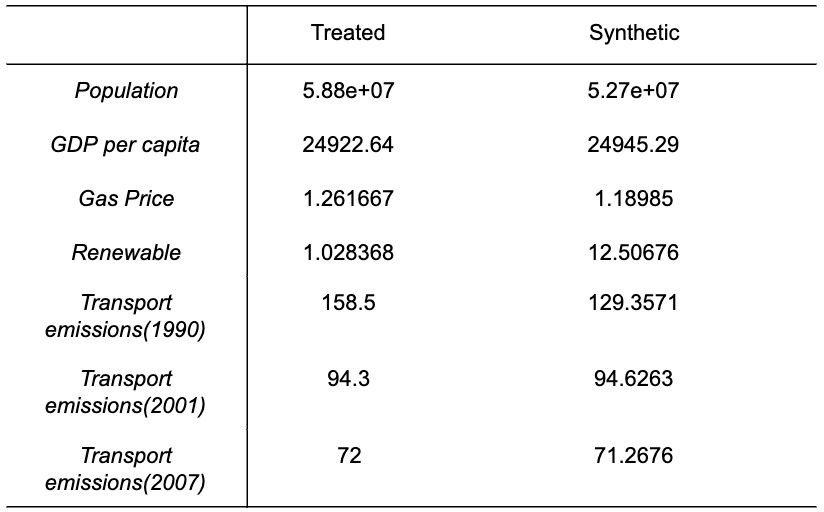
Table 1. Predictor Balance between the UK (treated) and the Synthetic.
As the table shows, the synthetic UK does a great job on accurately reproducing the values with the notable exception of the share of renewable energy, which is not balanced perfectly. This is very useful in seeing the way the model created this balance, raising the question of the donor units. Table 2 shows the weights given to donor European Countries. The weights reported in Table 2 indicate that transport emission trends before the passage of the Climate Change Act is best reproduced by a combination of Germany, France, Netherlands, Poland, and Finland.
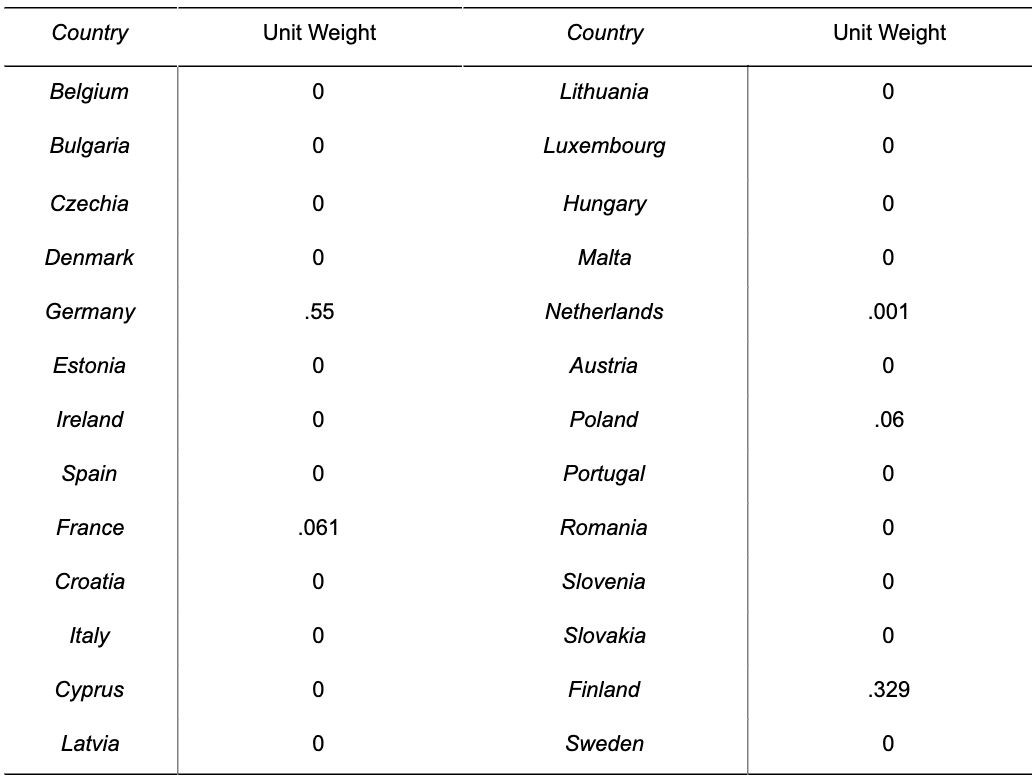
Table 2. Country weights in Synthetic UK.
The weights provided here allows us to create a Synthetic Control graph represented in figure 4, showing the effect of the policy after its implementation in 2008. The estimate for treatment effect is given as the deviation between the two lines after the treatment period, clearly denoted in the figure.
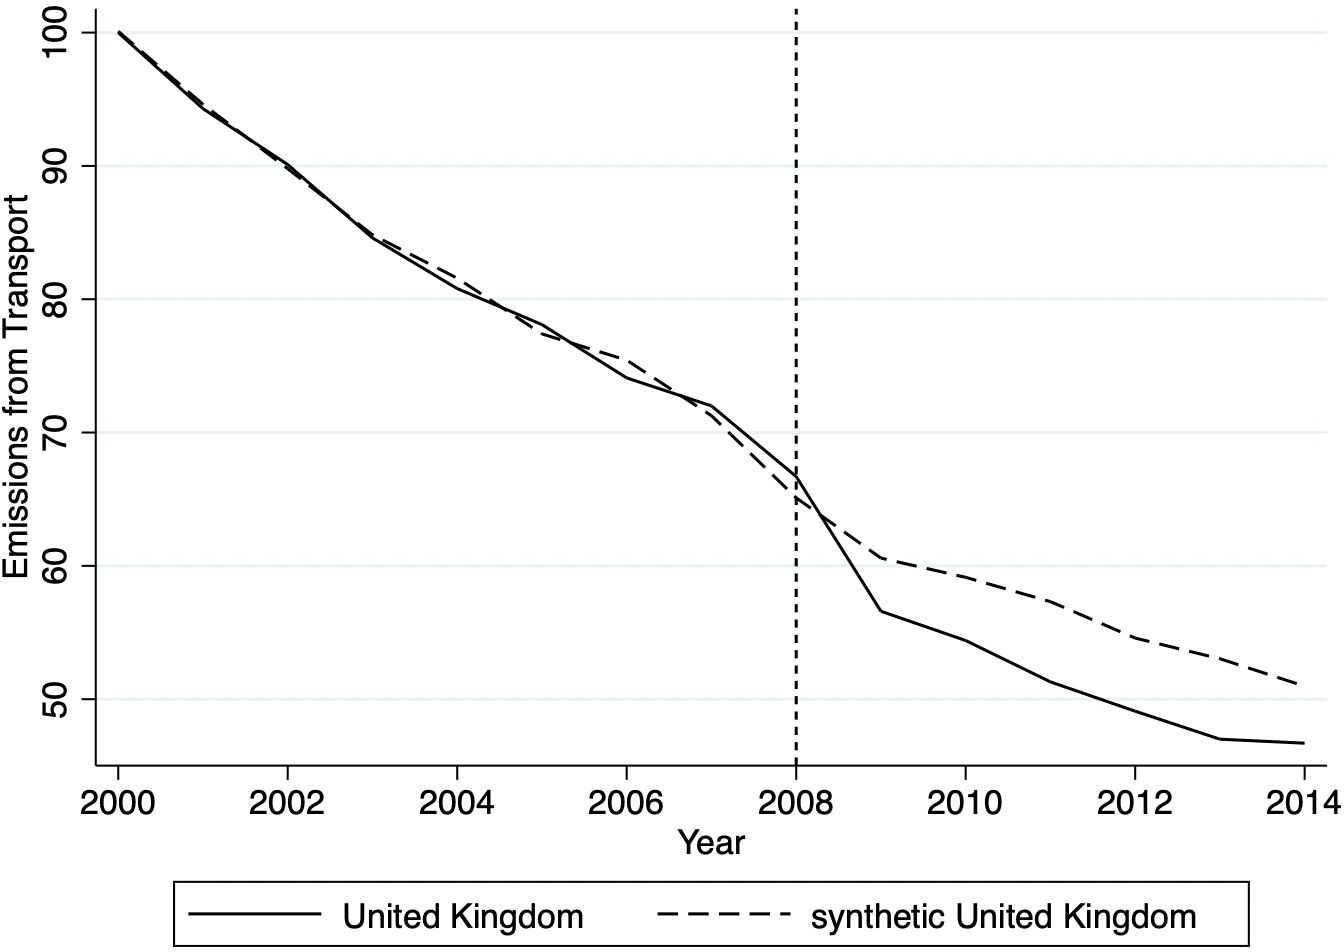
Figure 4. Trends in Emissions from Transport: United Kingdom vs. Synthetic United Kingdom
Almost immediately after the passage of the Climate change act, there is important deviance from the synthetic. The short period it takes before deviating can be accredited to a lagged effect due to the complexity and time-intensive nature of the policy. The discrepancy between the lines suggests a negative effect on emissions and figure 5 shows the magnitude of that effect a bit better, using the gap emissions between both control and treatment.
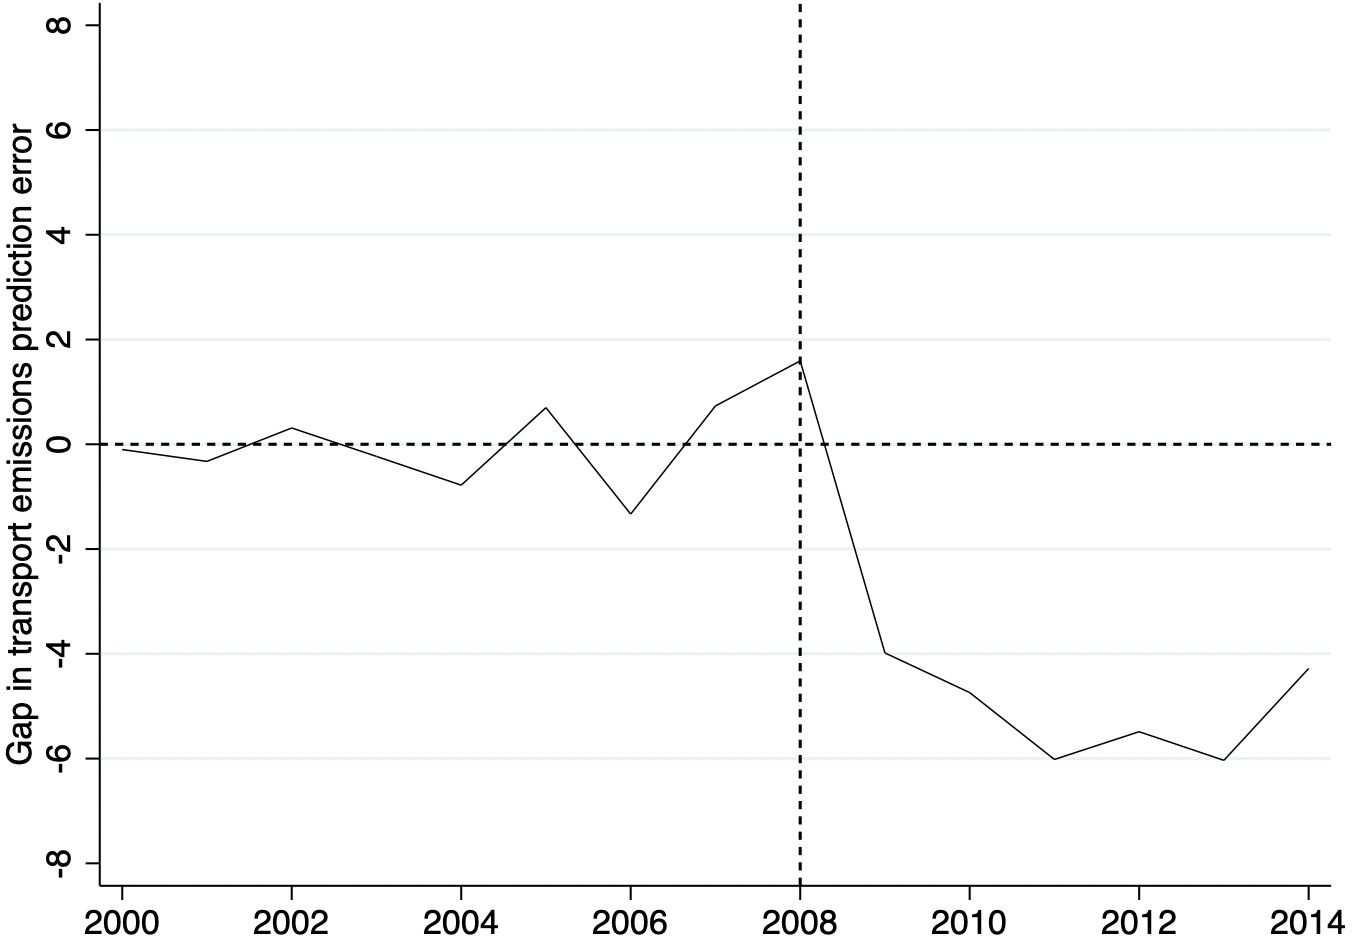
Figure 5. Emissions from transport gap between synthetic UK and the UK.
The effect seen in the figure seems to be important as it deviates quite notably after the treatment period. To assess the significance of these estimates, I conduct a series of placebo studies by iteratively applying the synthetic control method used to estimate the effect of the Climate Change Act in the UK to every other country in the donor pool. This procedure yields a distribution of estimated gaps for the countries without the intervention specified.
The grey lines in figures 6 and 7 show the placebo countries, while the black line represents the UK, the actual treated country. Figure 6 includes all of the data pool, while figure 7 is a more streamlined version with units that poorly fit the pre-treatment were eliminated.
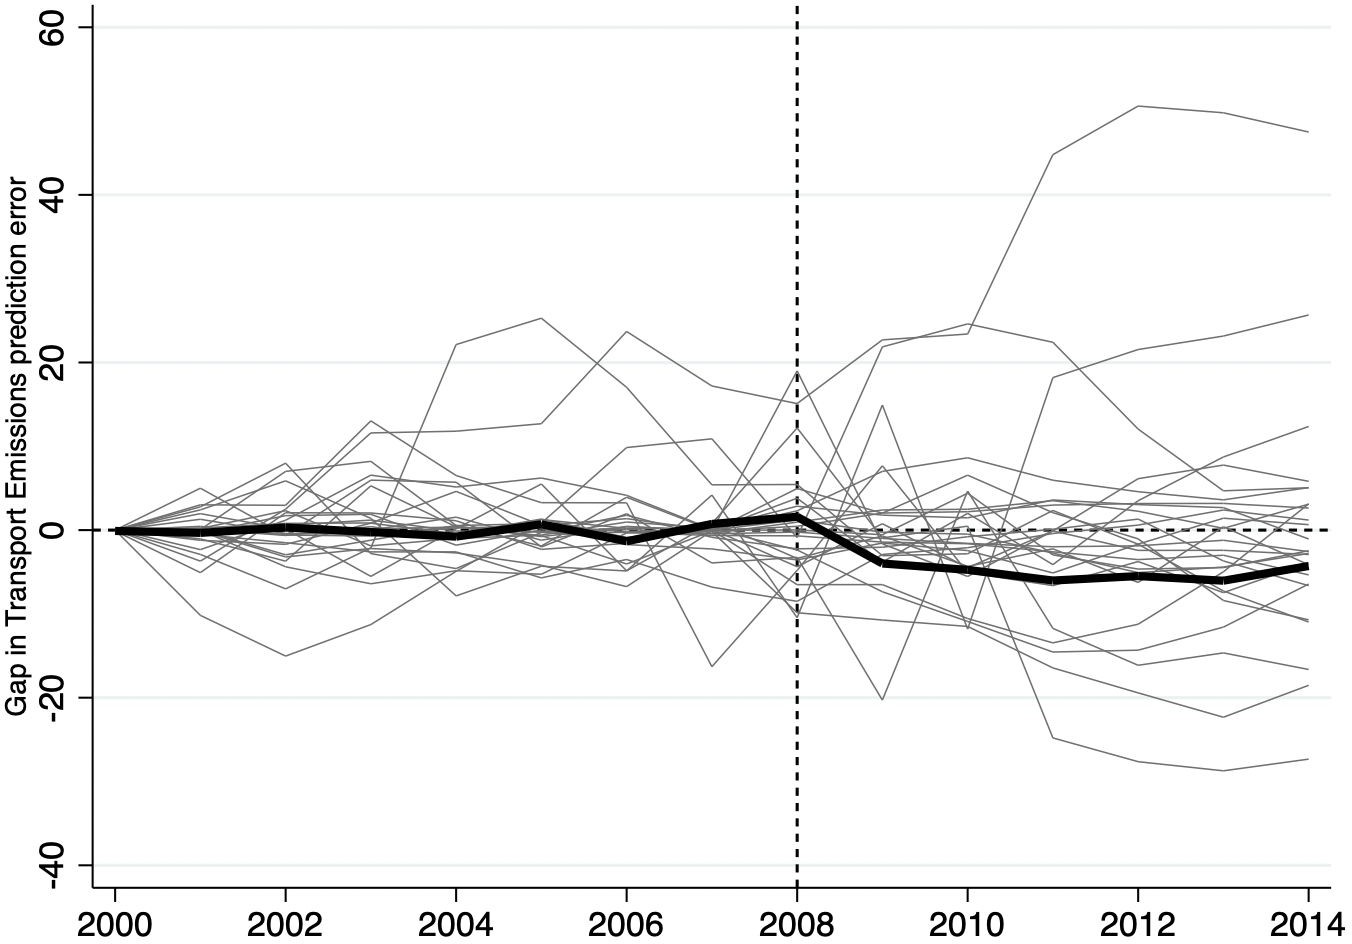
Figure 6. Transport emissions gaps in the UK and all the other 25 placebo countries
.
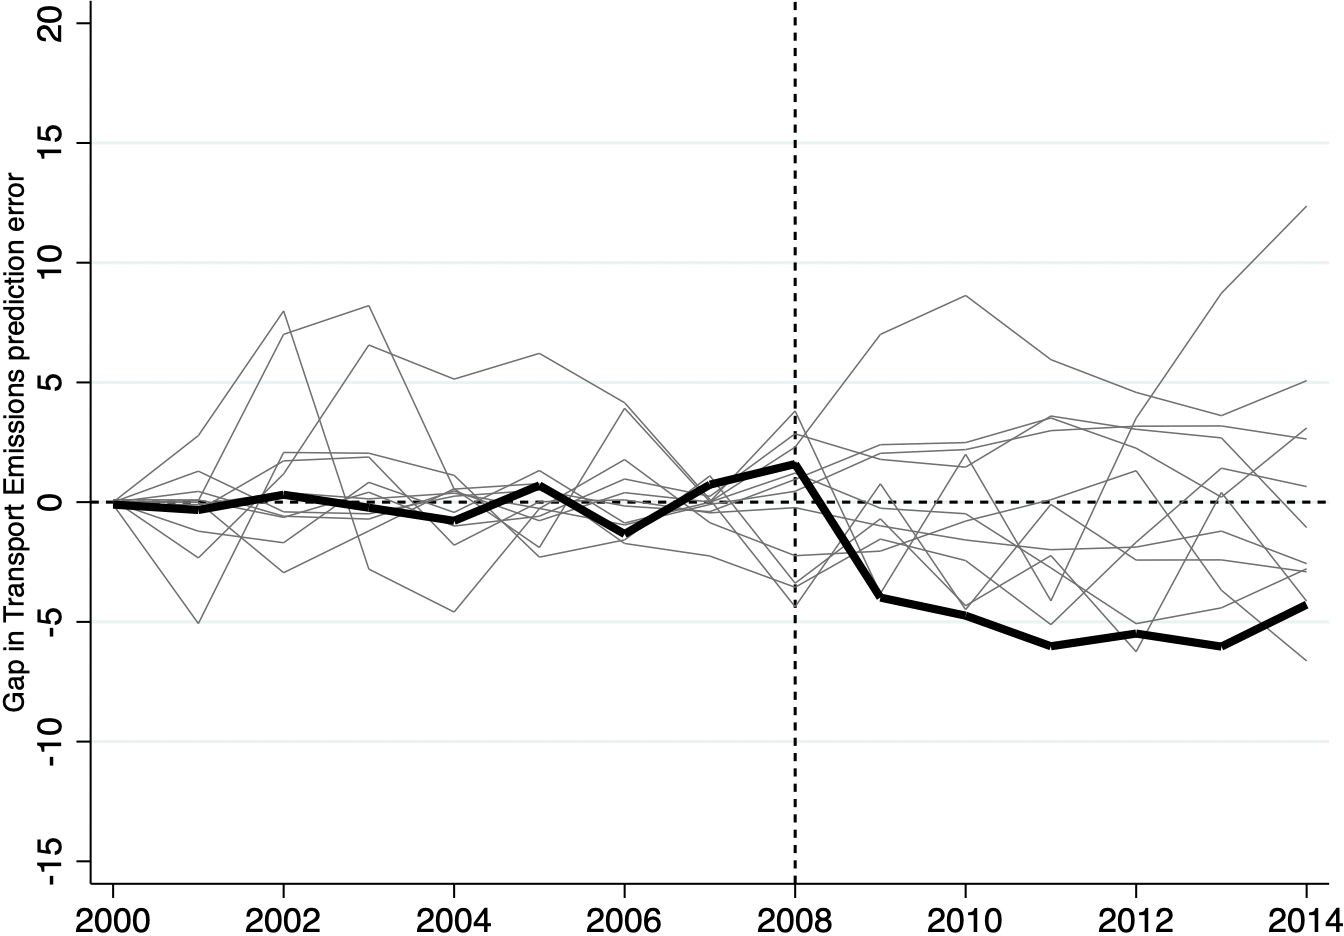
Figure 7. Transport emissions gaps in the UK and all the other 25 placebo countries (with the omission of units that poorly fit the pre-treatment period)
Figure 7 shows the way the UK is an outlier in the performance in these placebo tests, as the trend is quite visible compared to the other placebo units. As a way to be more robust about the results, the placebo tests provide an excellent framework to visually understand the relationship the gap takes concerning other unit's.
Conclusions
Although still a matter of debate, the Climate Change Act of 2008 had a positive effect in reducing the emissions from transport. The model used to estimate the effects is the SCM, which heavily relies on visual representations of data, and offers some limitations. As mentioned some threats to the validity of the results might be the spillover effects mentioned in external research, the existence of unobservables not accounted for, and external confounding factors such as broader political, social, or economic events. Nevertheless, this paper seeks to find an estimated causal effect on emissions from transport making use of a transparent, bias-reducing method which fits nicely into the research question.
As ratified by Lorenzoni & Benson (2014) and Rayner & Jordan (2011), the UK has taken on a massive challenge to reduce emissions in such a broad scale. This paper finds a positive advancement as emissions have been reduced. Further research looking into other sectors is recommended, as well as research tracking progress and the spillover effect briefly mentioned in this paper.
References
Abadie, A., Diamond, A., & Hainmueller, J. (2010). Synthetic Control Methods for Comparative Case Studies: Estimating the Effect of California’s Tobacco Control Program. Journal of the American Statistical Association, 105(490), 493–505. doi: 10.1198/jasa.2009.ap08746
Arroyo, V., Zyla, K., & Pacyniak, G. (2017). New strategies for reducing transportation emissions and preparing for climate impacts. Fordham Urban Law Journal, 44(4).
Blazejczak, J., Braun, F., Edler, D., & Schill, W. (2011). Economic Effects of Renewable Energy Expansion. Retrieved 5 November 2019, from https://www.diw.de/documents/publikationen/73/diw_01.c.385049.de/dp1156.pdf
Cunningham, S. (2018). www.scunning.com. Retrieved December 13, 2019, from http://www.scunning.com/cunningham_mixtape.pdf.
European Union Open Data Portal. (2019). Datasets. Retrieved December 12, 2019, from https://data.europa.eu/euodp/en/data/dataset?q=transport+emissions&ext_boolean=any&s ort=.
Lorenzoni, I., & Benson, D. (2014). Radical institutional change in environmental governance: Explaining the origins of the UK Climate Change act 2008 through discursive and streams perspectives. Global Environmental Change, 29, 10-21. doi:10.1016/j.gloenvcha.2014.07.011
McClelland, R., & Gault, S. (2017). The Synthetic Control Method as a Tool to Understand State Retrieved December 15, 2019, from https://www.urban.org/sites/default/files/publication/89246/the_synthetic_control_metho d_as_a_tool_0.pdf.
Pålsson, H., & Johansson, O. (2016). Reducing transportation emissions. Benchmarking, 23(3), 674-703.
Pye, S., Sabio, N., & Strachan, N. (2015). An integrated systematic analysis of uncertainties in UK energy transition pathways. Energy Policy, 87, 673-684. DOI:10.1016/j.enpol.2014.12.031
Rayner, T. & Jordan, A. (2011). The United Kingdom: A paradoxical leader? The European Union as a leader in international climate change politics. Retrieved from https://www.taylorfrancis.com/books/e/9780203839959/chapters/10.4324/978020383995 9-16
UK Government. (2008). Climate Change Act 2008. Retrieved December 13, 2019, from https://www.legislation.gov.uk/ukpga/2008/27/contents.
World Bank. (2019). Datasets on Indicators worldwide. Retrieved December 12, 2019, from https://data.worldbank.org/indicator/EN.ATM.CO2E.KT.
Appendix
Link to full code: https://gist.github.com/Aaronmoralesshildrick/e6ef532955ccb220f9c903df0f27faca
[i] Check out https://www.exploring-economics.org/de/entdecken/stiglitz-on-globalization-why-globalization-fails-/ for famous economist Joseph Stiglitz’s explanation barriers to economic development
[ii] https://www.exploring-economics.org/de/entdecken/free-trade-economic-theories/
[iii] https://www.exploring-economics.org/de/entdecken/economic-theory-methodology-and-secure-foundatio/
[iv] Check out https://www.exploring-economics.org/en/discover/an-introduction-to-game-theory-in-public-policy/ from last year’s fellowship